The European Space Agency
Home
APEx Application Propagation Environments
Main navigation
  • Algorithm Support
  • Project Environments
    QGIS
    CodeServer
    JupyterLab
    Web Portal
    Geospatial Explorer
    Documentation Hub
    User Forum
    Product Catalogue
  • Resources
    • Algorithm Catalogue
    • Data Catalogue
    • Geospatial Explorer
    • Demo Project Environment
  • Community
    • Documentation
    • User Forum
    • FAQ
  • About APEx
    • Mission Statement
    • News
Contact us
Main navigation
  • Algorithm Support
  • Project Environments
  • Resources
  • Community
  • About APEx
APEx - Documentation Portal
  1. Guides
  2. Admin Guides
  3. Grafana monitoring dashboards
  • Welcome
  • On-demand EO services
    • Using openEO service
    • Supported Platforms
  • Project Environments
    • Use Cases
    • Customisation
    • Accessing your environment
    • Geospatial Explorer
    • Project Web Portal
    • Code Server IDE
    • JupyterLab IDE
    • QGIS as a Remote Desktop
    • Product Catalogue
    • Documentation Portal
    • User Forum
  • Algorithm Support
    • On-Demand EO Services
    • Use Cases
    • Algorithm Porting
    • Algorithm Onboarding
    • Algorithm Upscaling
    • Algorithm Enhancement
    • Toolbox Cloudification
    • Algorithm Intercomparison
  • Guides
    • Developer Guides
      • Authentication
        • Creating an APEx account
        • Creating APEx single sign-on token
      • openEO
        • Creating openEO based services
        • Upscaling openEO based services
      • EOAP
        • Creating EOAP based services
      • APEx Product Catalogue
        • Ingesting STAC metadata in APEx Product Catalogue
        • Linking APEx Product Catalogue with an openEO service
      • APEx Algorithm Catalogue
        • Registering your service
        • Creating benchmarks for your service
        • APEx Algorithm Dashboard
    • Admin Guides
      • Creating an APEx account
      • Grafana monitoring dashboards
      • Custom domains for your project environment
      • Geospatial Explorer
        • Configuring the APEx Geospatial Explorer
      • Project Web Portal
        • Login to the Project Web Portal and the Drupal content overview
        • Manage web pages or add a new page
        • Edit web pages via paragraphs
        • Add content and/or visuals
        • Add a Call-To-Action (CTA)
        • Add news items and an overview of the latest or all news
        • Add an event and an overview of the latest or all events
        • Add a web form
        • Add a logo (partners) banner
        • Add publications or downloads (files)
        • Edit the menu navigation
        • Edit the footer
        • Customizing the look and feel
        • Manage Partners Block
        • Manage Tags and Themes
        • Customizing Site Name and Slogan
    • Consumer Guides
      • Using the Geospatial Explorer
  • Interoperability and Compliance Guidelines
    • Definitions & Actors
    • Algorithm Service Development Options
    • Algorithm Developer and Provider Guidelines
    • Data Provider Guidelines
    • Algorithm Hosting Platforms Guidelines
    • Geospatial Explorer
    • Federated Business Model
  1. Guides
  2. Admin Guides
  3. Grafana monitoring dashboards

Grafana Monitoring Dashboards

Overview

APEx provides Grafana dashboards for project-level operational monitoring. The Grafana instance for each project follows this URL pattern:

  • https://grafana.<project>.apex.esa.int/

Example:

  • https://grafana.demo.apex.esa.int/

This guide explains how to access the dashboards and what information is available.

Access and Authentication

To access Grafana:

  1. Open your project URL, for example https://grafana.demo.apex.esa.int/.
  2. Select Sign in with APEx SSO on the Grafana login page.
  3. Complete authentication using your APEx account.

If you do not yet have an APEx account, follow the Creating an APEx account guide.

Note that having an APEx account is required but not sufficient on its own. Your account must also be explicitly authorised for the target project environment.

If authentication succeeds but you do not see your project dashboards, request environment access through APEx support.

Available Dashboards

Two dashboards are available for day-to-day operational monitoring:

  • Ingress list
  • Project monitoring

Ingress list dashboard

The Ingress list dashboard provides a quick inventory of exposed endpoints for your namespace/project.

Main capabilities:

  • Lists ingress host names currently configured for the selected project.
  • Shows which application each host name routes to.
  • Supports filtering by datasource, namespace, ingress name, and project name.
  • Supports standard Grafana time-window filtering for recent changes.

Use this dashboard when you need to:

  • confirm the public host name of a deployed service,
  • verify whether a specific endpoint exists,
  • cross-check which component is behind a given ingress host.
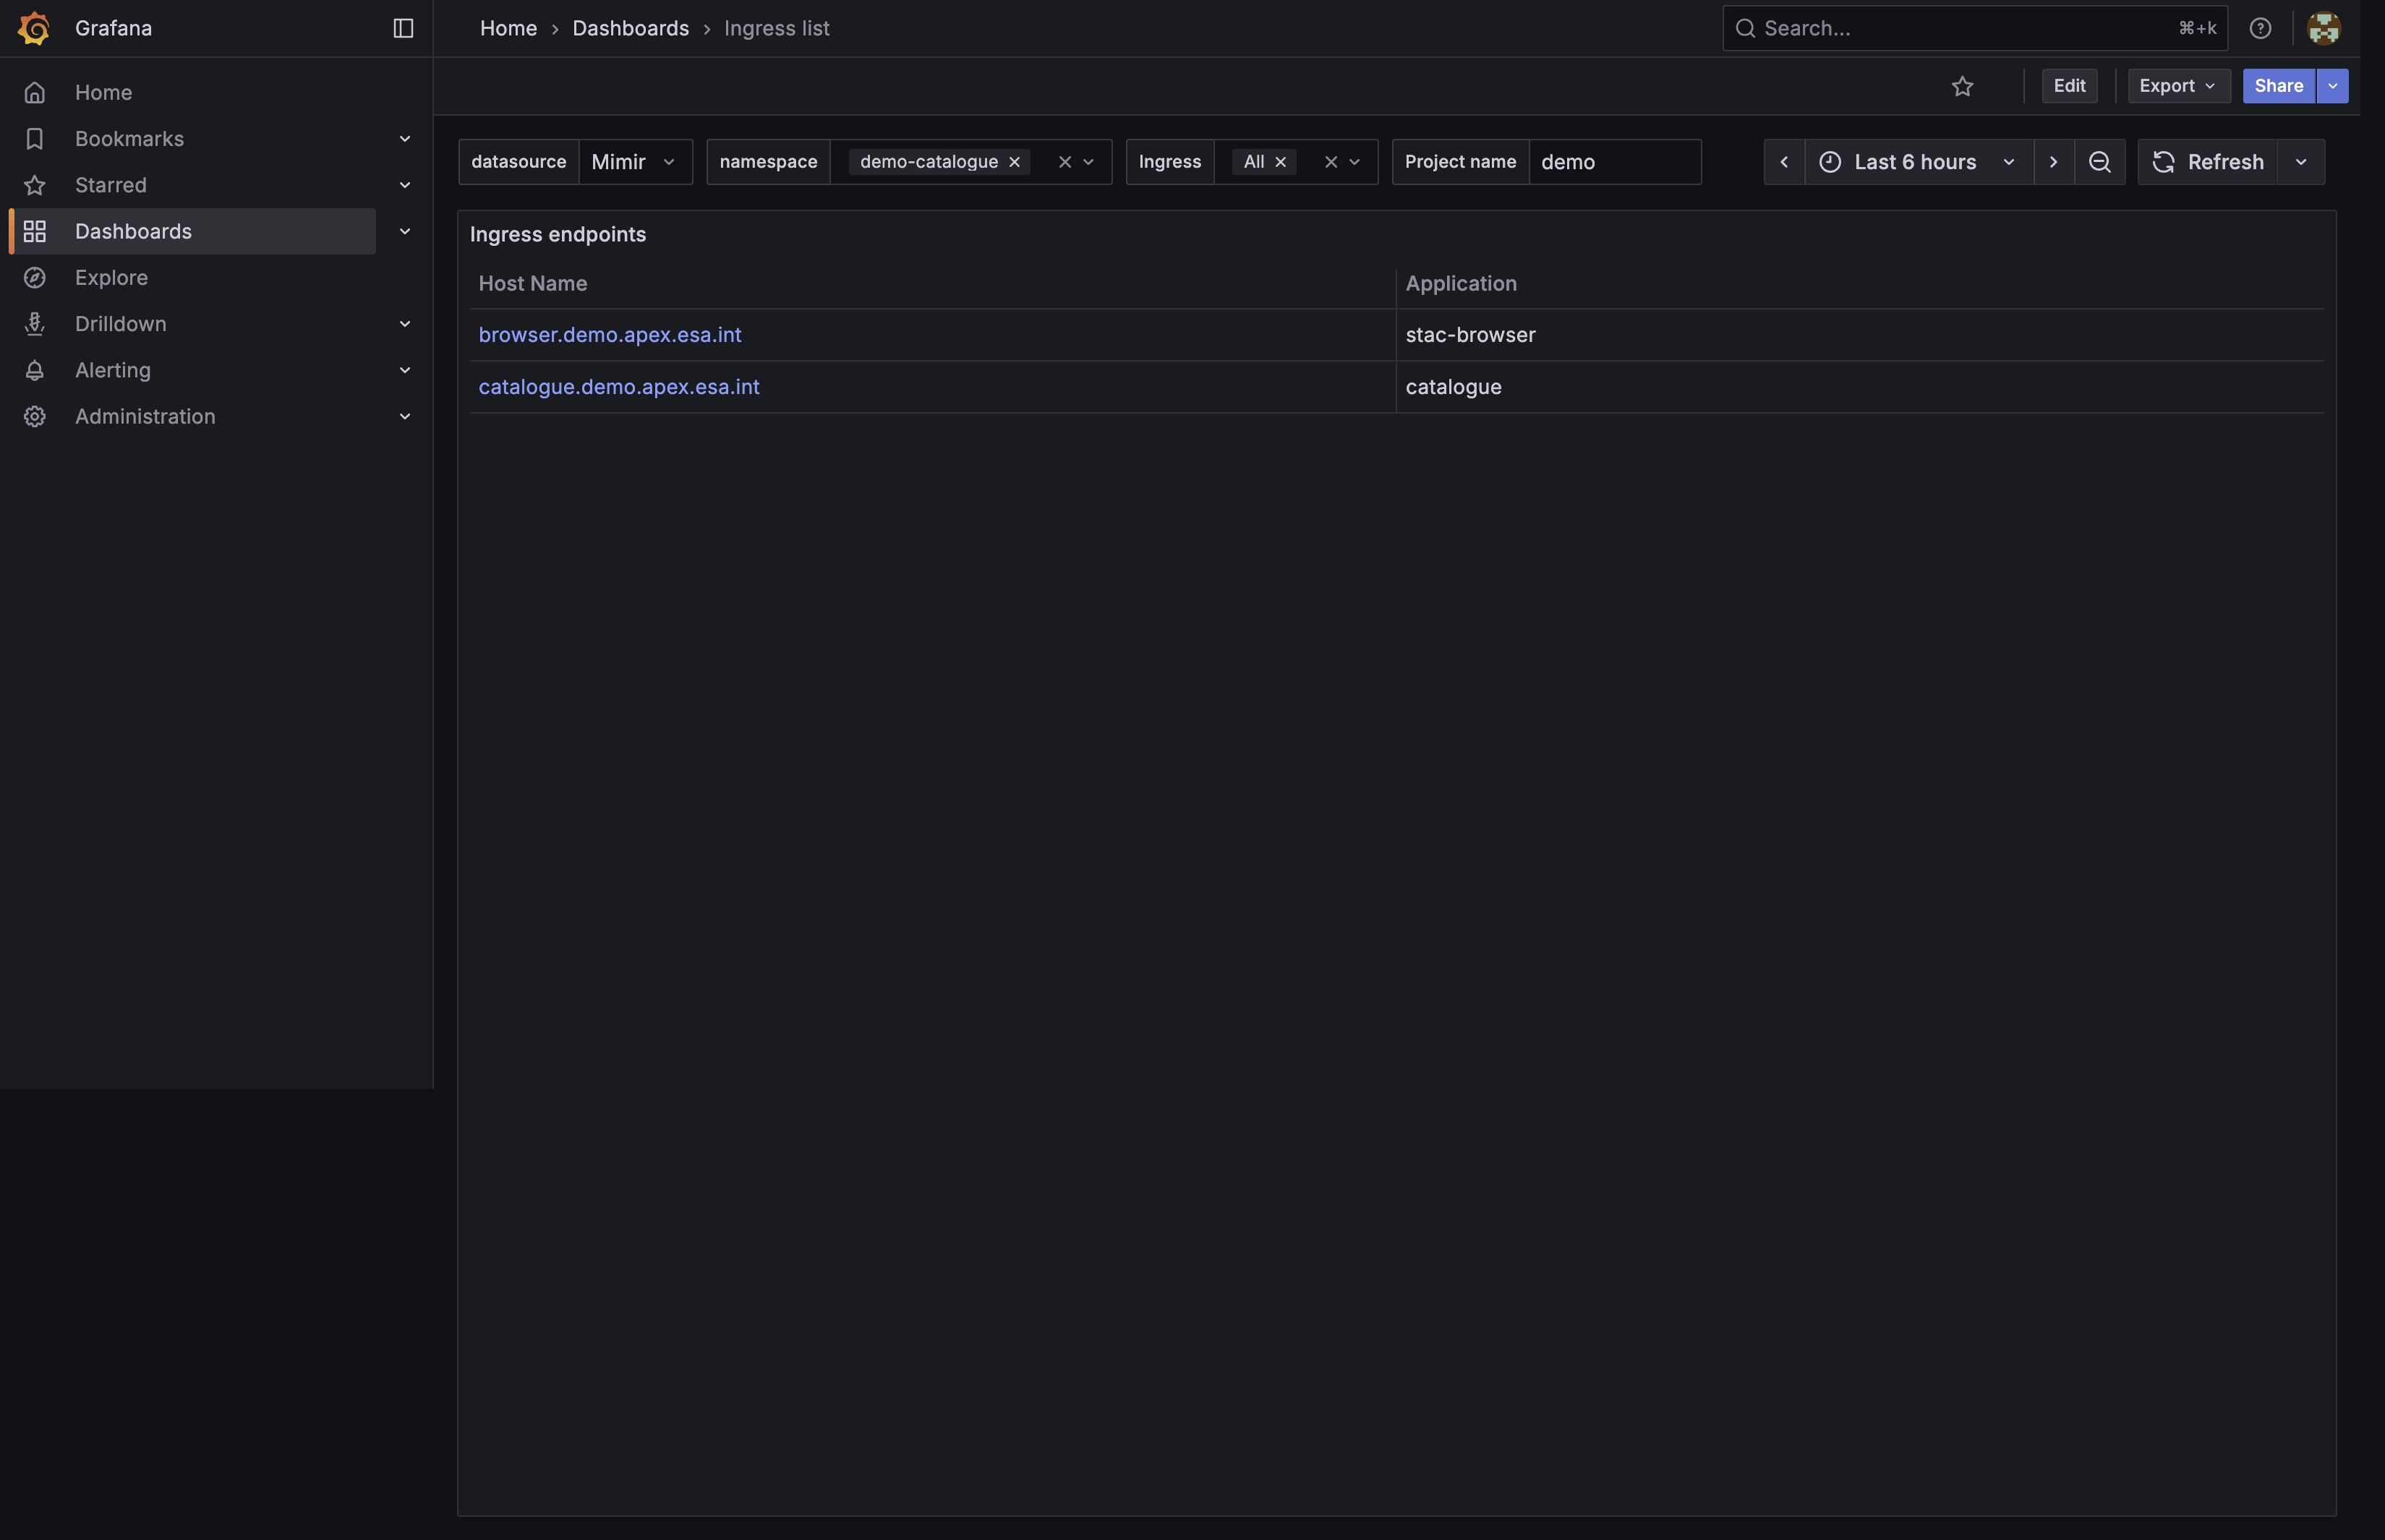
Grafana Ingress list dashboard

Project monitoring dashboard

The Project monitoring dashboard provides workload health and usage indicators for core deployed components in the project namespace.

Main capabilities:

  • CPU usage trends per component.
  • Memory usage trends per component.
  • Container readiness overview.
  • Restart counters to detect instability.
  • Per-project filtering to focus on one environment.

Use this dashboard when you need to:

  • check whether services are healthy and ready,
  • identify resource pressure (CPU or memory growth),
  • investigate recurring restarts,
  • validate platform state during incident triage.
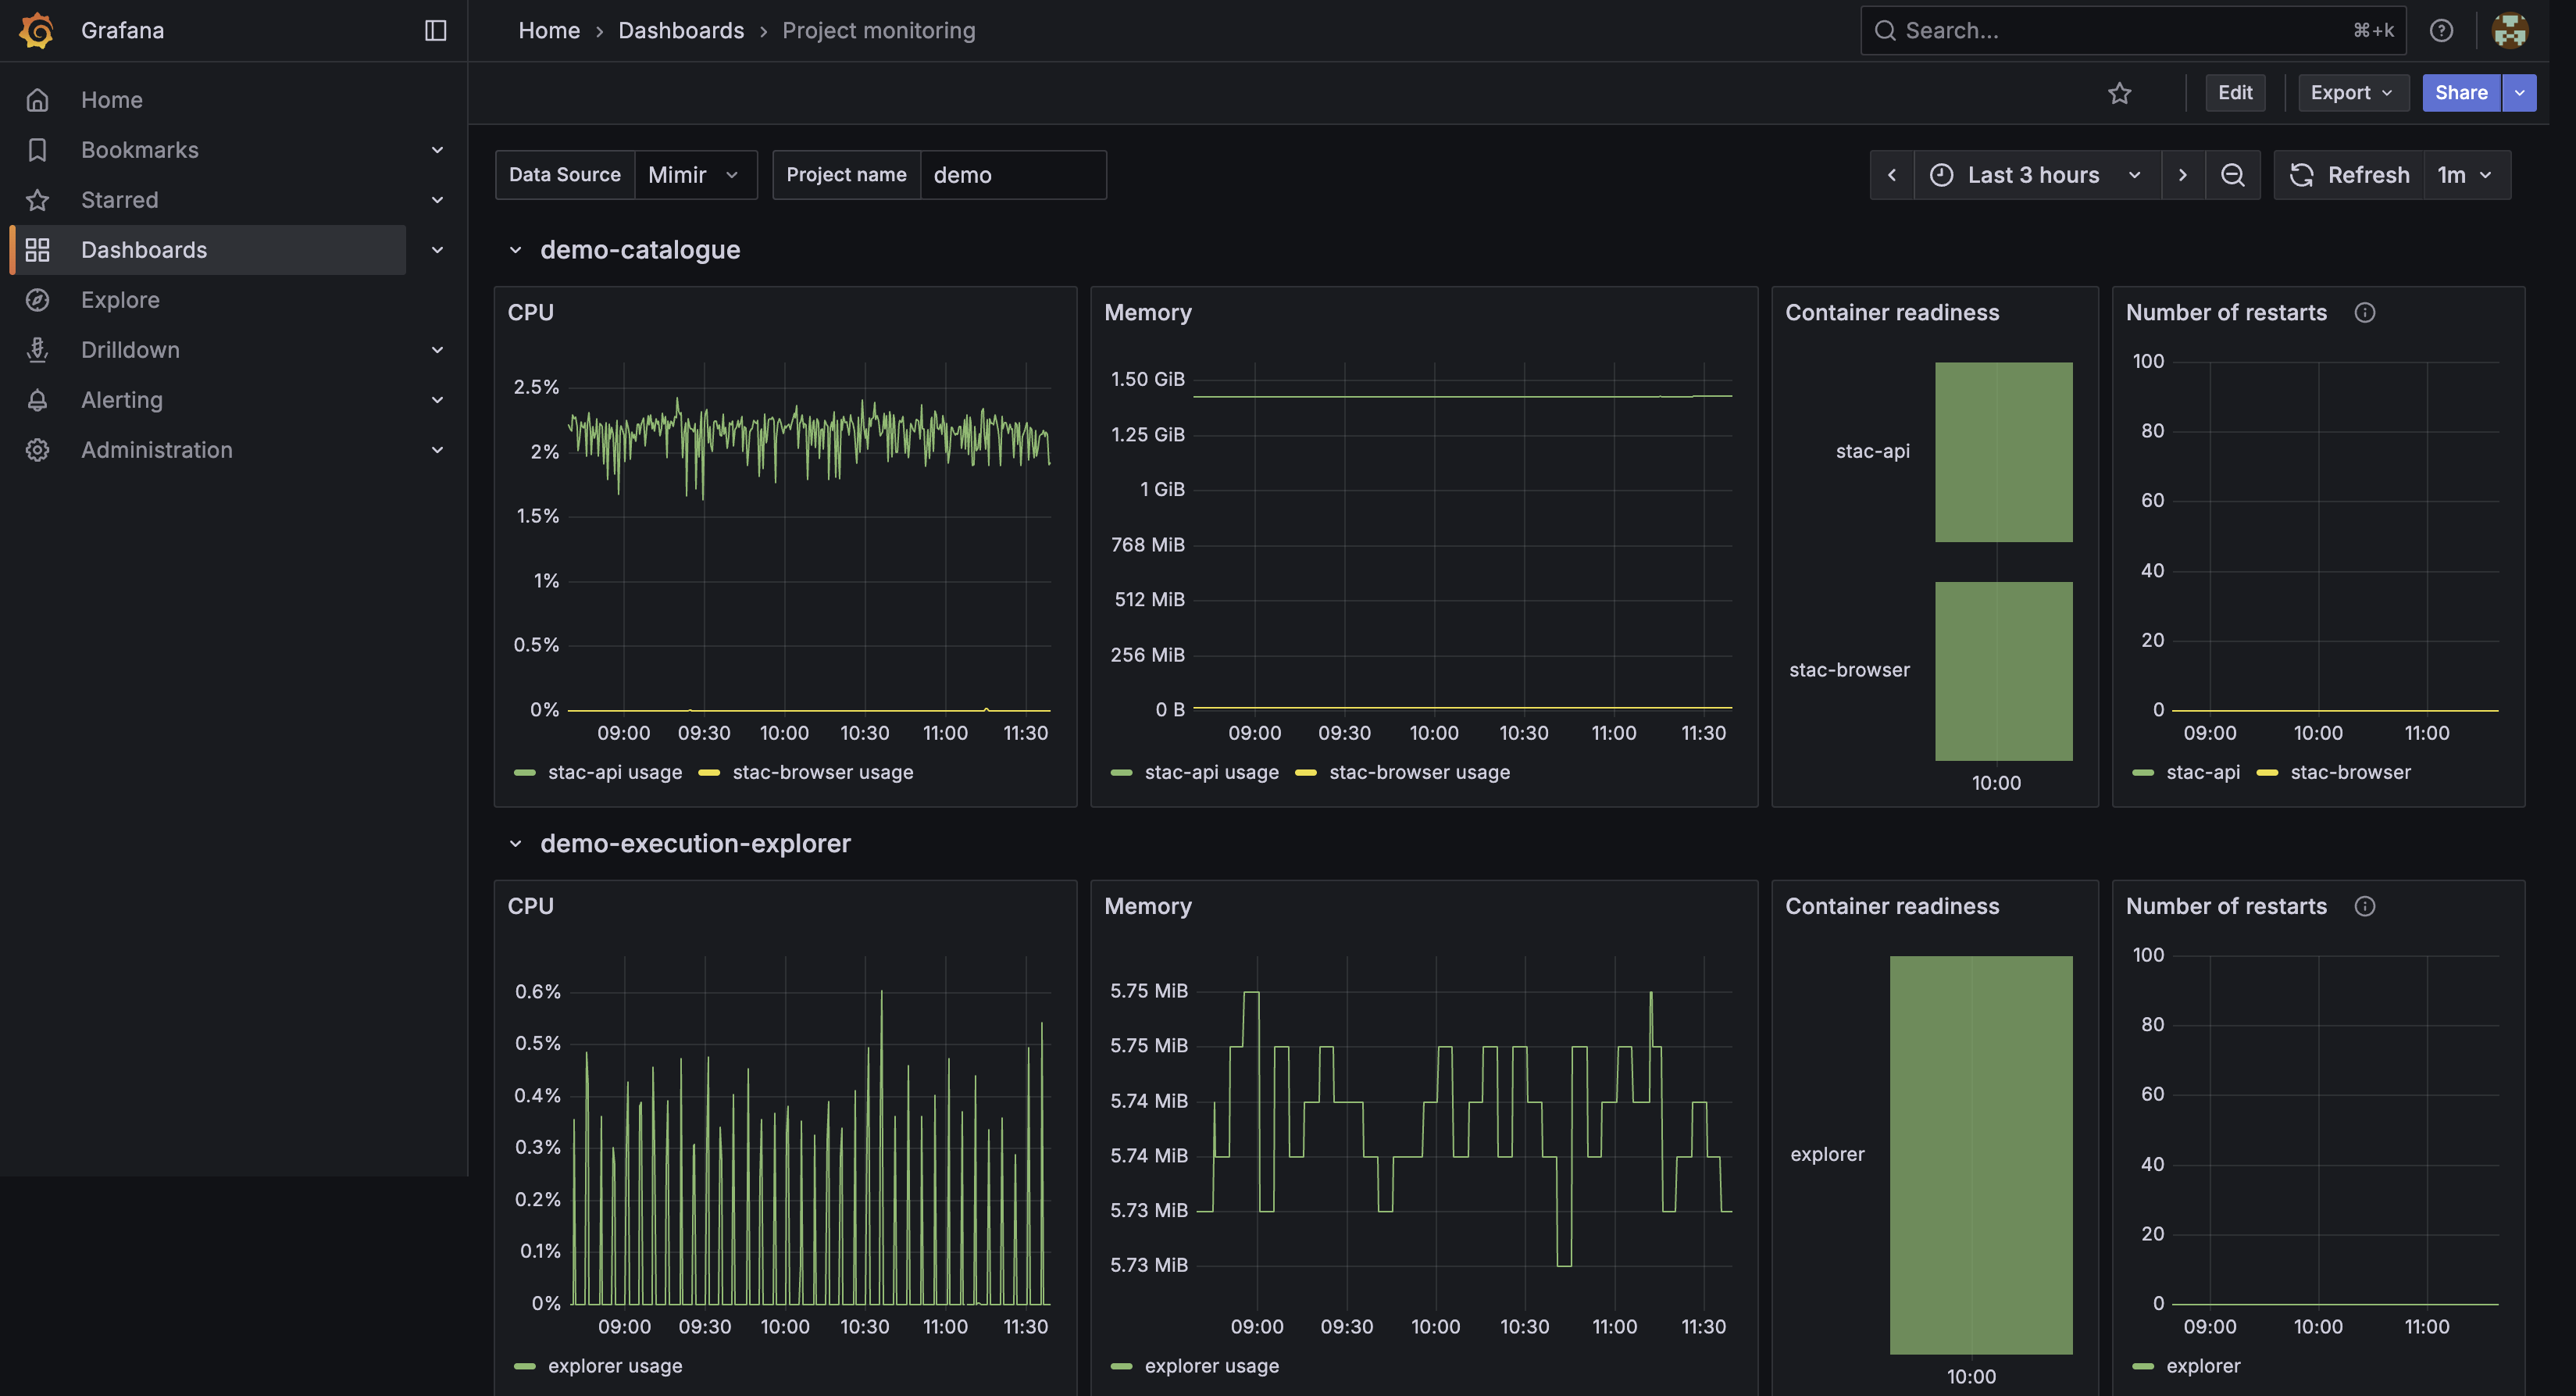
Grafana Project monitoring dashboard

Tips

  • Start with Ingress list to validate endpoint routing.
  • Continue with Project monitoring to inspect runtime health.
  • Keep the dashboard time range aligned with the time of an observed issue.
APEx Algorithm Dashboard
Custom domains for your project environment