
APEx Algorithm Dashboard
Overview
The APEx Algorithm Dashboard is a web-based administration interface that is part of the broader APEx Algorithm Catalogue application. While the public-facing Algorithm Catalogue allows anyone to browse and discover algorithms that have been onboarded onto APEx, the Algorithm Dashboard provides authorised users with deeper operational insight into those same algorithms, including benchmark health, performance metrics, cost analytics, and scenario-level detail.
The Dashboard is intended primarily for APEx operators, service administrators, and algorithm providers who need to monitor the operational status of registered services and diagnose issues beyond what is visible in the public catalogue.
The public Algorithm Catalogue, available at https://algorithm-catalogue.apex.esa.int/, does not require a login and is covered separately. This page focuses exclusively on the Dashboard (admin area), which requires authentication.
Key Capabilities
Algorithm & Benchmark Overview
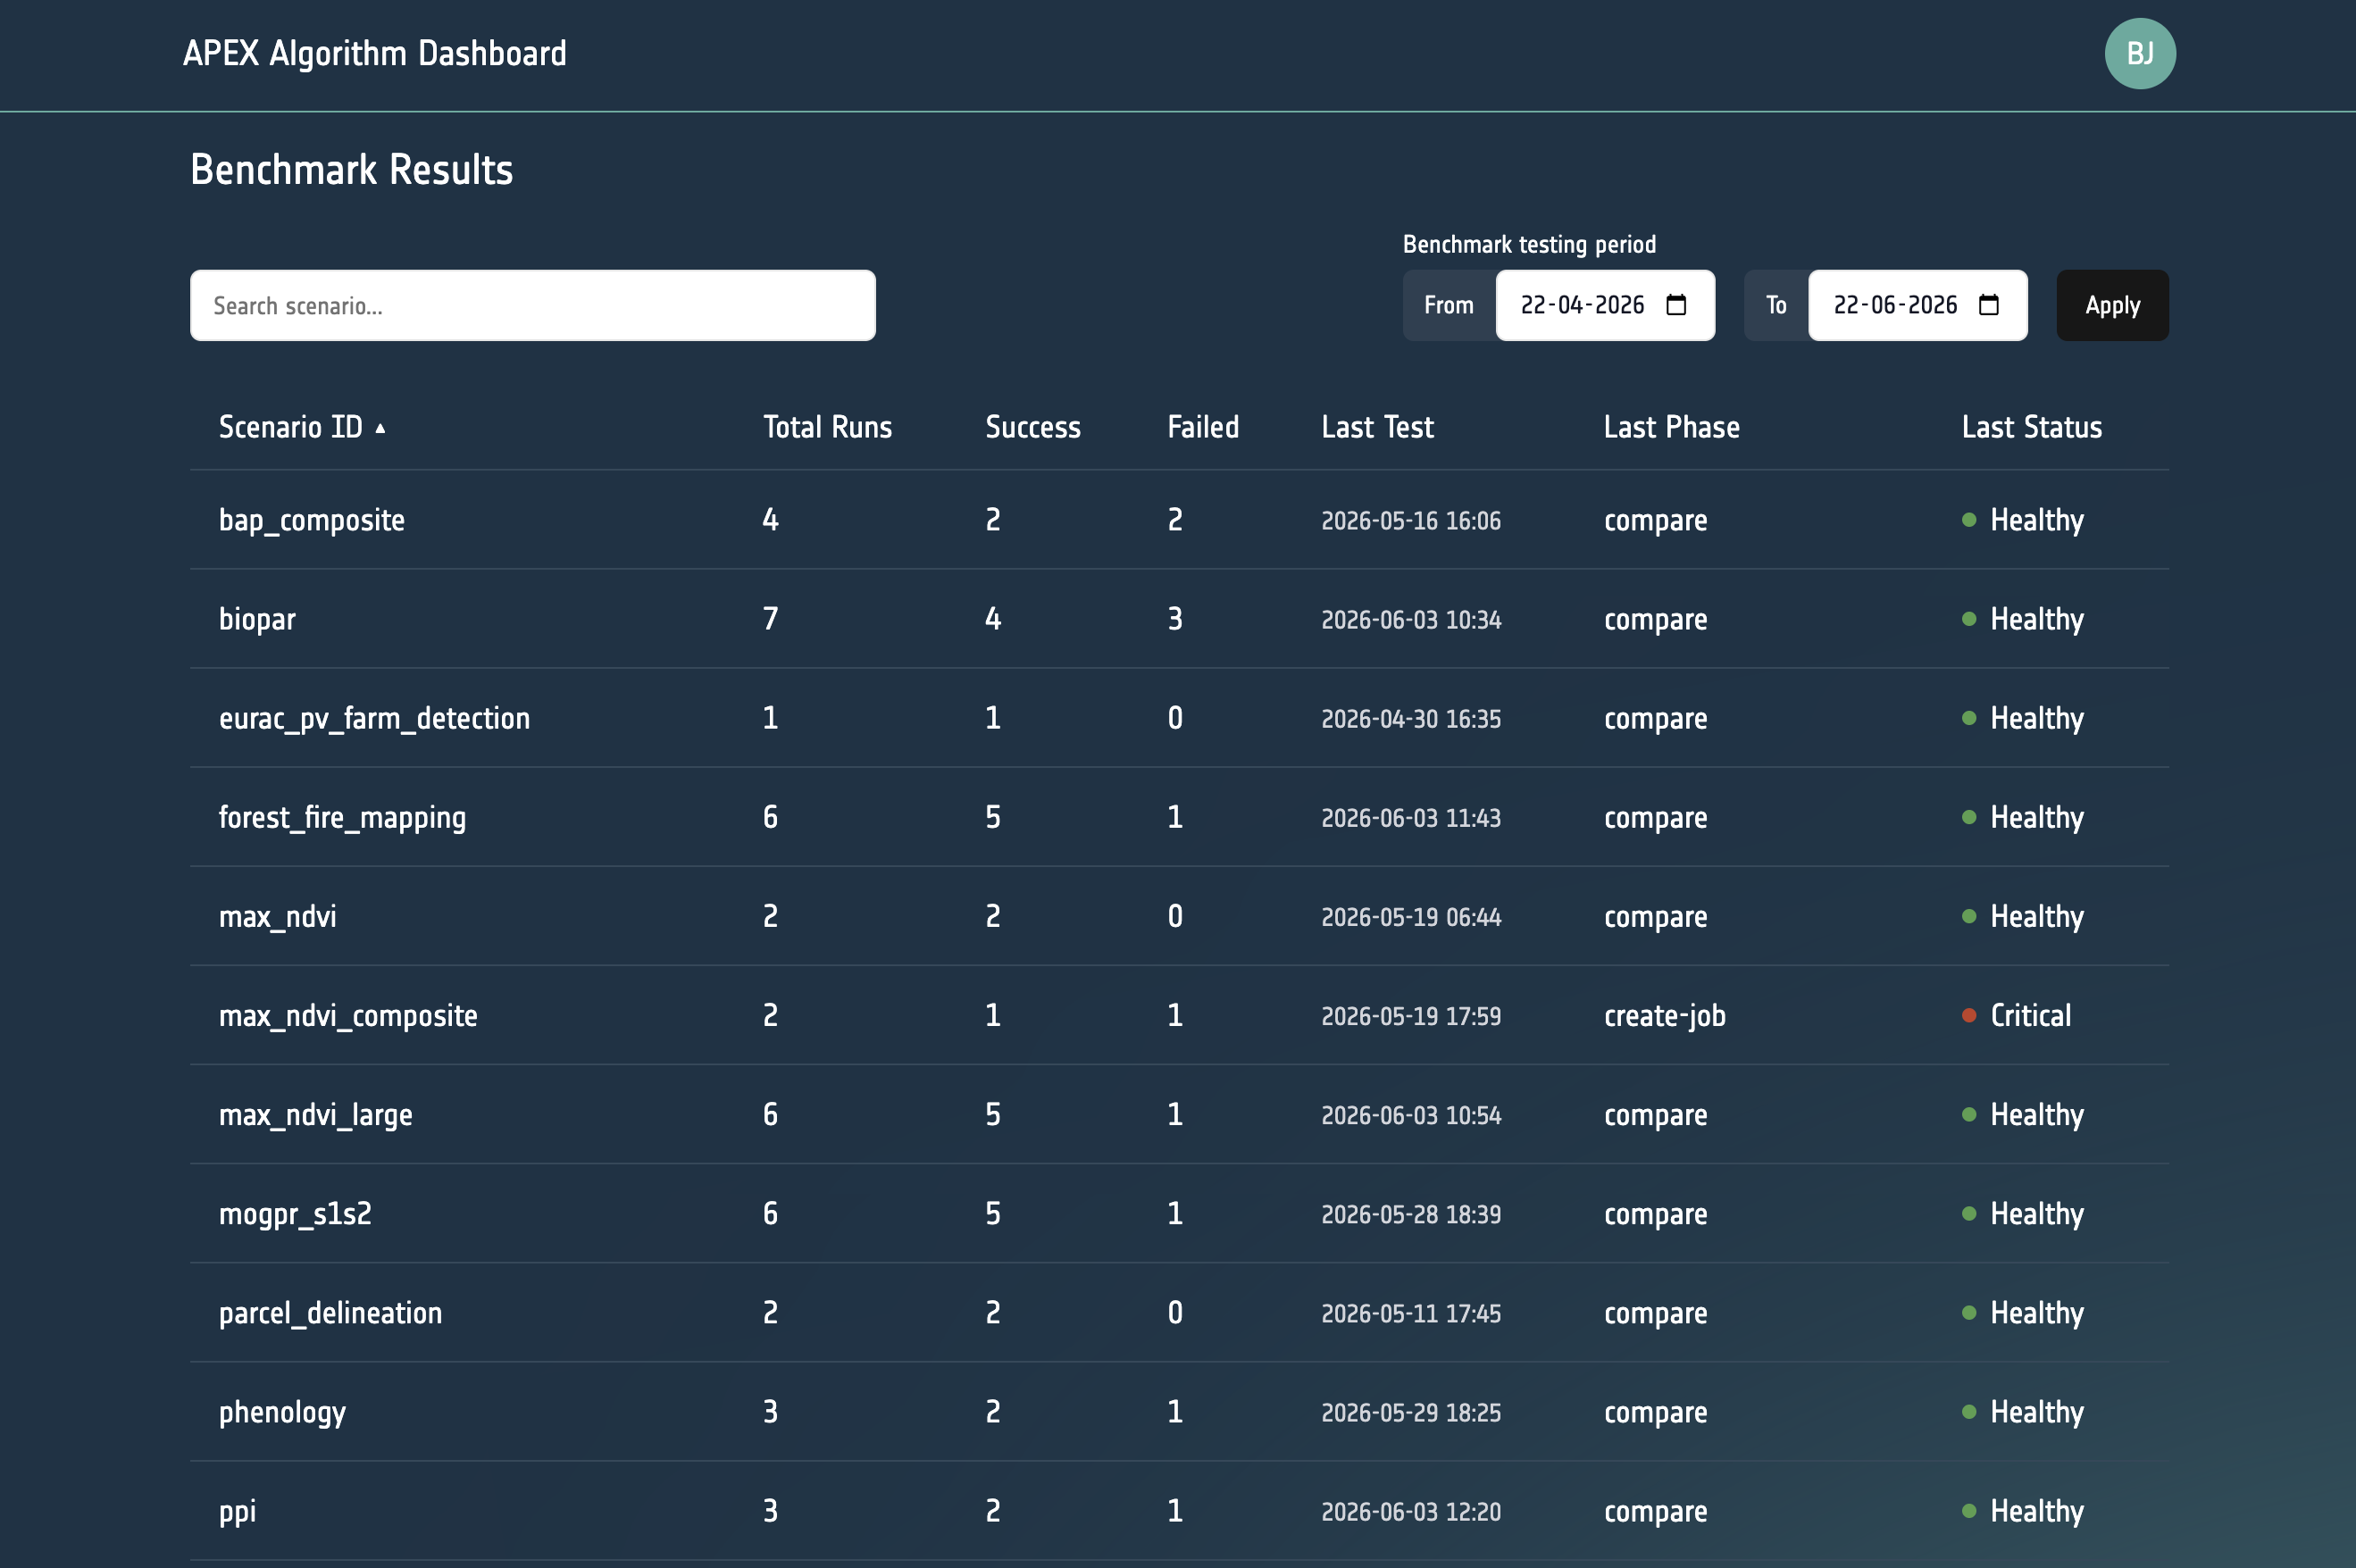
The Dashboard landing page presents a consolidated table of all algorithms registered in the catalogue together with the current benchmark health status of each registered scenario. For each algorithm the table shows:
- Algorithm name and provider platform
- Benchmark status badge (
healthy,warning,critical, orno benchmark) - Number of test runs, success count, and failure count
- Date and phase of the most recent test run
Operators can use this view to spot at a glance which services are degraded or have never been benchmarked.
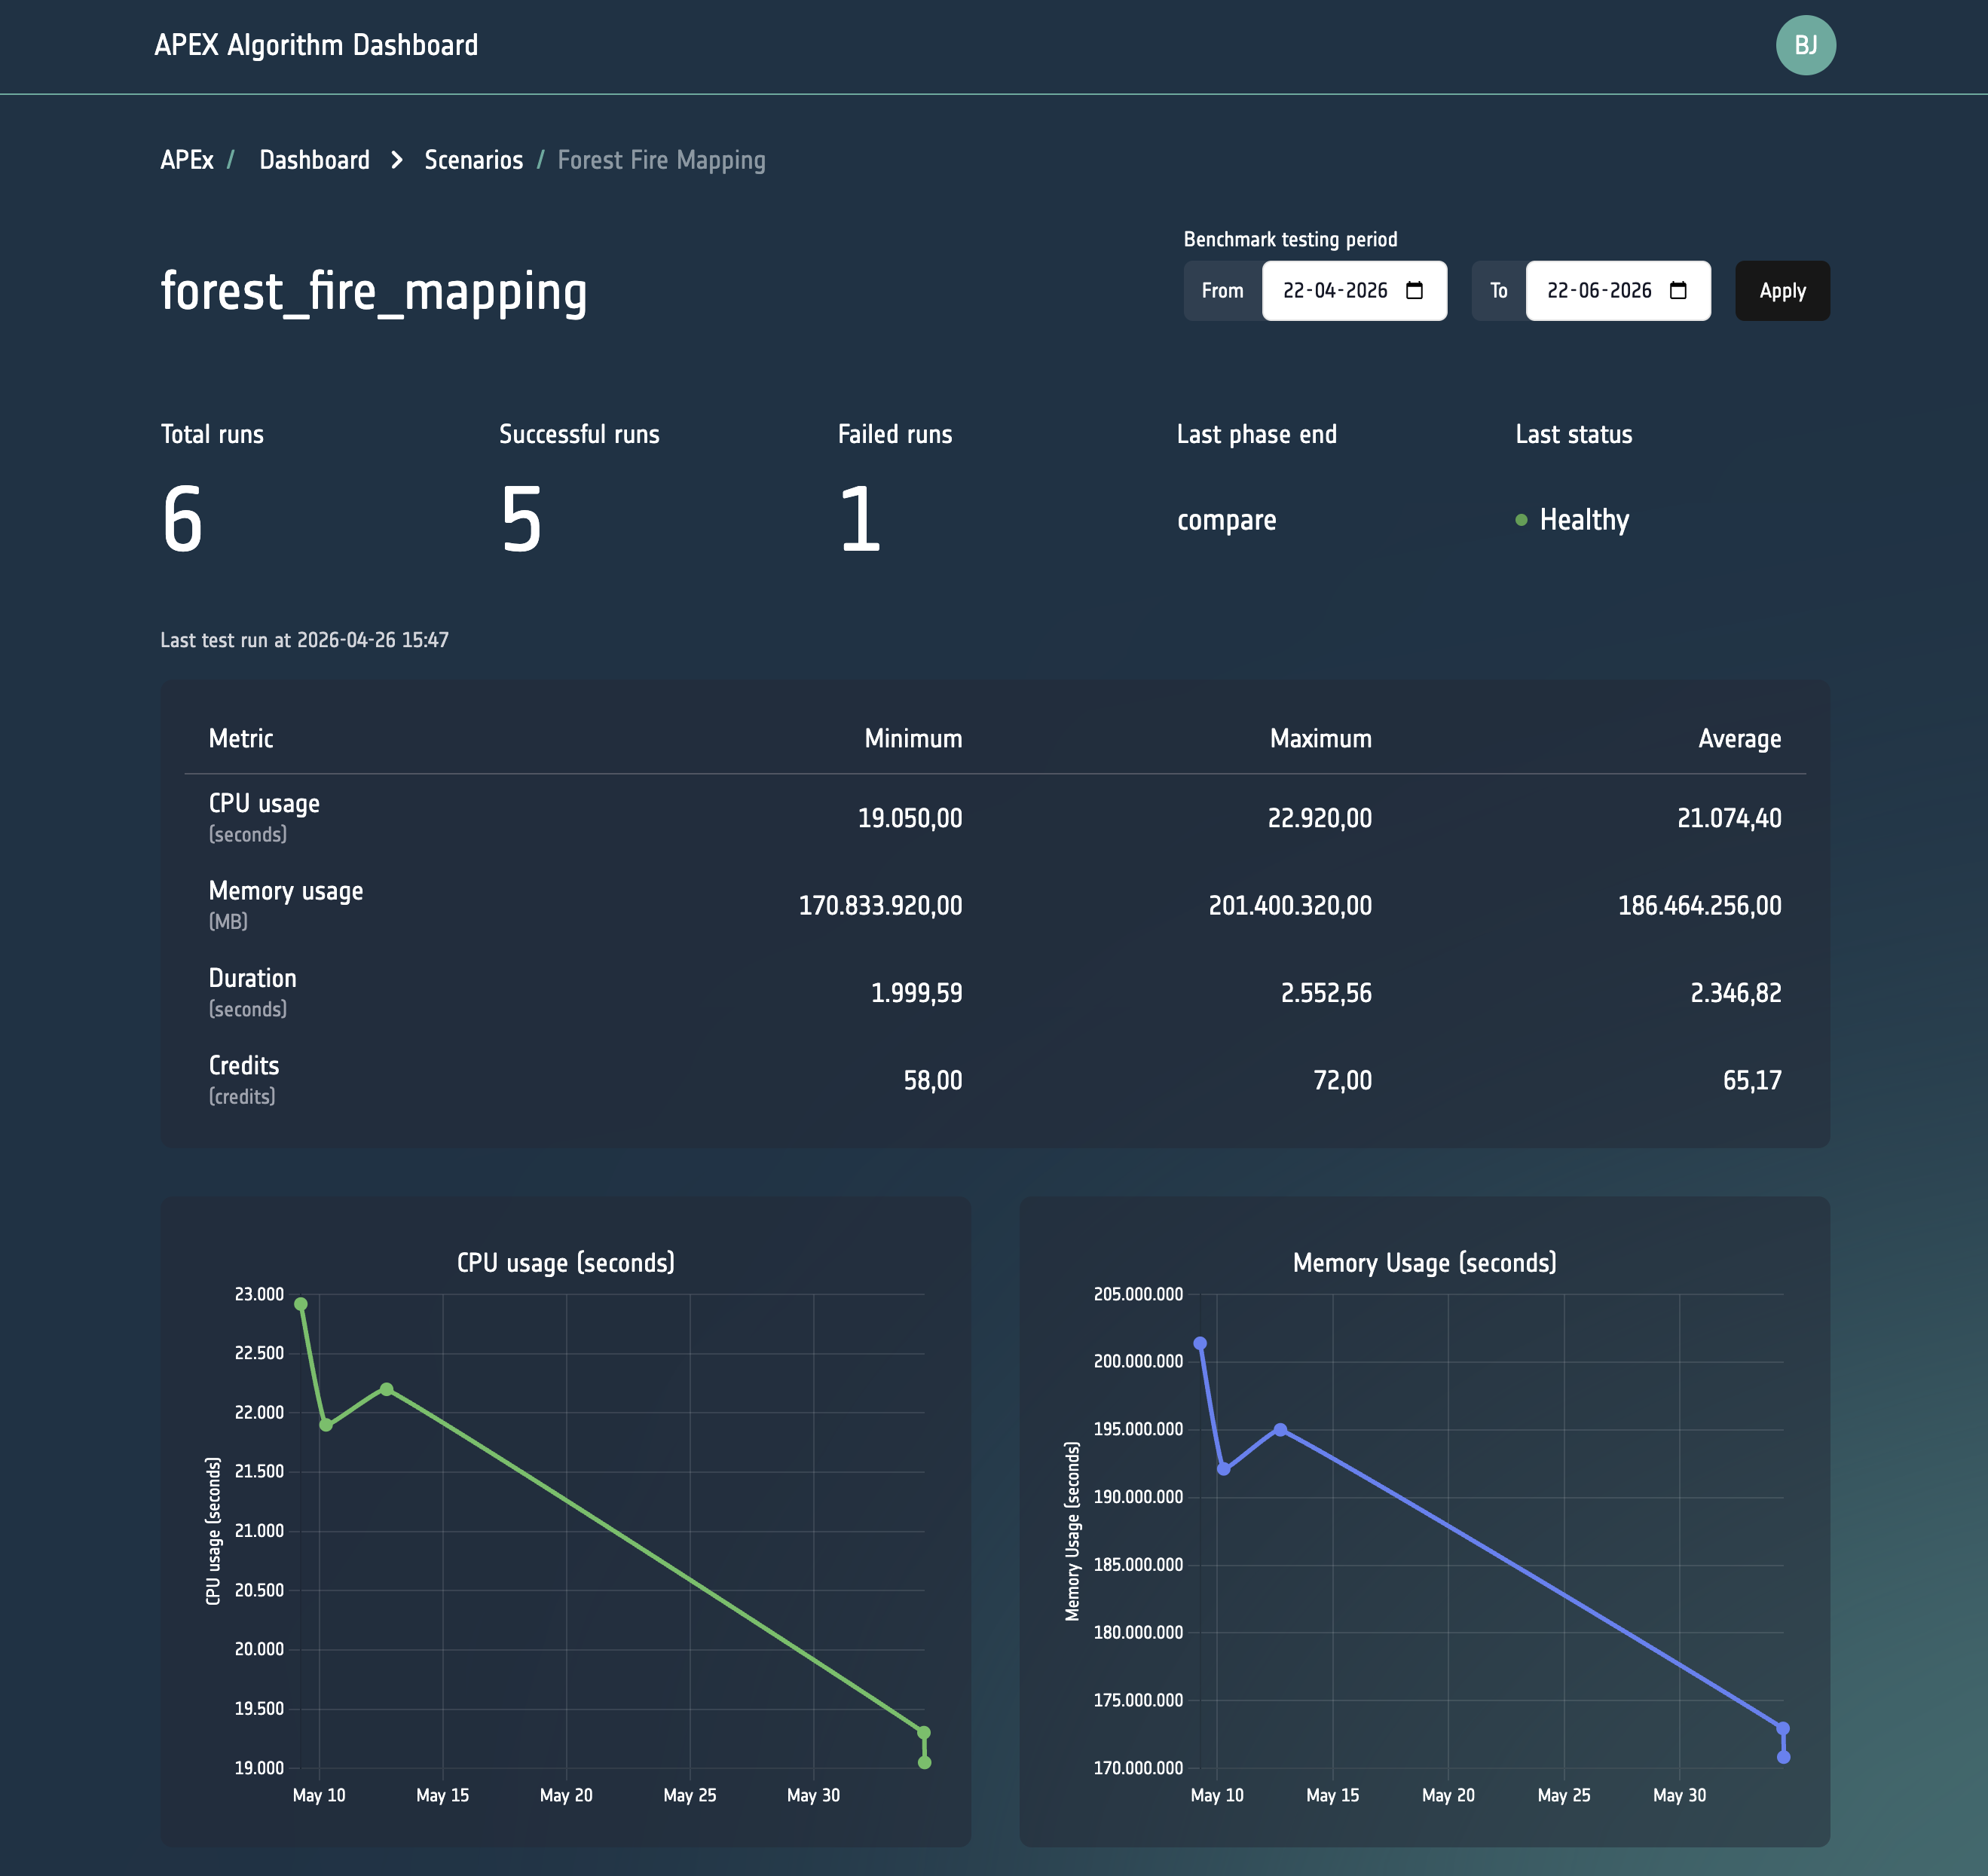
Scenario-level Drill-down
Clicking on a row in the overview table navigates to a per-scenario detail page that contains:
- Benchmark metrics table — tabular view of individual test runs, including CPU (seconds), memory (MB-seconds), cost, duration (seconds), input pixel count (mega-pixels), maximum executor memory (GB), network received (bytes), and area size (km²).
- Time-series line chart — visualises how key metrics (e.g. duration, cost) evolve across successive test runs, making it easy to detect regressions.
The metrics shown in the Dashboard depend on the metrics provided by the algorithm hosting platform where the benchmark is executed. Availability and precision of individual metrics may vary across platforms.
GitHub Notifications
Whenever a benchmark fails, a GitHub issue is automatically created on the APEx Algorithm Catalogue repository to notify service providers and operators. These issues automatically include detailed diagnostic information to facilitate rapid issue resolution:
- Service parameters: the configuration and parameters used for the failed benchmark execution
- Execution details: runtime information such as duration, resource utilization, and platform-specific metadata
- Application logs: complete error messages and application output from the failed run
This automated notification system ensures that failures are immediately communicated and that all necessary debugging information is readily available without requiring a manual inspection.
Date-range Filtering
Both the overview and the scenario detail pages support date-range filtering so that operators can focus on a specific time window and compare periods.
Benchmark Status Badges
Each algorithm and scenario is assigned a colour-coded status badge that summarises the outcome of the most recent test run:
| Status | Meaning |
|---|---|
healthy |
The most recent test run completed successfully |
warning |
A recent run finished with degraded performance |
critical |
The most recent run failed |
no benchmark |
No test scenario has been registered for this algorithm yet |
Roles & Permissions
The Dashboard uses the APEx Keycloak for authentication. For instructions on creating an APEx user account, see the APEx User Account Guide.
Access to the Dashboard is configured through the acl (access control list) property on the corresponding Provider record in the APEx Algorithm Catalogue. More information is available in our APEx Algorithm Catalogue Guide
Requesting Access
Who Can Request Access
Dashboard (admin) access is intended for:
- APEx team members and operators responsible for maintaining the Algorithm Catalogue
- Algorithm providers who need detailed diagnostic information about the health of their own registered services and who cannot resolve an issue using the public benchmark status alone
- ESA staff or project partners with a justified need to inspect benchmark data across multiple algorithms
If you only need to browse or discover algorithms, you do not need Dashboard access, the public APEx Algorithm Catalogue is openly accessible without any login.
How to Request Access
Access to a provider’s services can be requested by creating an issue on the APEx Algorithm Catalogue repository.