The European Space Agency
Home
APEx Application Propagation Environments
Main navigation
  • Algorithm Support
  • Project Environments
    QGIS
    CodeServer
    JupyterLab
    Web Portal
    Geospatial Explorer
    Documentation Hub
    User Forum
    Product Catalogue
  • Resources
    • Algorithm Services Catalogue
    • Data Catalogue
    • Geospatial Explorer
  • Community
    • Documentation
    • User Forum
    • FAQ
  • About APEx
    • Mission Statement
    • News
Contact us
Main navigation
  • Algorithm Support
  • Project Environments
  • Resources
  • Community
  • About APEx
APEx - Documentation Portal
  1. User Guides
  2. Geospatial Explorer
  3. Using the Geospatial Explorer
  • Welcome
  • On-demand EO services
    • Using openEO service
    • Supported Platforms
  • Project Environments
    • Use Cases
    • Customisation
    • Accessing your environment
    • Geospatial Explorer
    • Project Portal
    • Code Server IDE
    • JupyterLab IDE
    • QGIS as a Remote Desktop
    • Product Catalogue
    • Documentation Portal
    • User Forum
  • Algorithm Support
    • On-Demand EO Services
    • Use Cases
    • Algorithm Porting
    • Algorithm Onboarding
    • Algorithm Upscaling
    • Algorithm Enhancement
    • Toolbox Cloudification
    • Algorithm Intercomparison
  • Developer Guides
    • Authentication
      • Creating an APEx account
      • Creating APEx single sign-on token
    • openEO
      • Creating openEO based services
      • Upscaling openEO based services
    • EOAP
      • Creating EOAP based services
    • APEx Product Catalogue
      • Ingesting STAC metadata in APEx Product Catalogue
      • Linking APEx Product Catalogue with an openEO service
    • APEx Algorithm Services Catalogue
      • Registering your service
      • Creating benchmarks for your service
    • File format recommendations
  • User Guides
    • Custom domains for your project environment
    • Geospatial Explorer
      • Configuring the APEx Geospatial Explorer
      • Using the Geospatial Explorer
    • Project Portal
      • Login to the Project Portal and the Drupal content overview
      • Manage web pages or add a new page
      • Edit web pages via paragraphs
      • Add content and/or visuals
      • Add a Call-To-Action (CTA)
      • Add news items and an overview of the latest or all news
      • Add an event and an overview of the latest or all events
      • Add a web form
      • Add a logo (partners) banner
      • Add publications or downloads (files)
      • Edit the menu navigation
      • Edit the footer
      • Customizing the look and feel
  • Interoperability and Compliance Guidelines
    • Definitions & Actors
    • Algorithm Service Development Options
    • Algorithm Developer and Provider Guidelines
    • Data Provider Guidelines
    • Algorithm Hosting Platforms Guidelines
    • Geospatial Explorer
    • Federated Business Model
  1. User Guides
  2. Geospatial Explorer
  3. Using the Geospatial Explorer

Using the Geospatial Explorer

The APEx Geospatial Explorer is a web map application with a configurable user interface that can be used to showcase the results of ESA projects as interactive maps, tables and charts. This user guide provides some general user guidance for a number of supported features.

Note

Users should be aware that the configuration of any specific Geospatial Explorer page will determine what is available on a case by case basis. Examples of instantiated versions of the Geospatial Explorer are listed here on the project overview page.

Navigating around the map

There are a number of options for navigating around the map:

You can
  • Use the “+” and “-” icons on the map to zoom in and out
  • Double click on the map to zoom in
  • Hold “shift” and double click on the map to zoom out
  • Hold “shift” and draw a rectangle on the map to zoom to a specific area of interest
  • Click and drag on the map to pan Hold “alt”, “shift” then click and drag on the map to rotate
  • Click on the arrow in the top right to reset the map to north up

A scale bar of your map view is visible in the bottom left of the map, and the latitude and longitude of your current cursor location at the bottom right.

Layer groups and layers

The left hand panel of the Geospatial Explorer is used to add data to the map. Typically data is organised into layer groups.

Layer groups

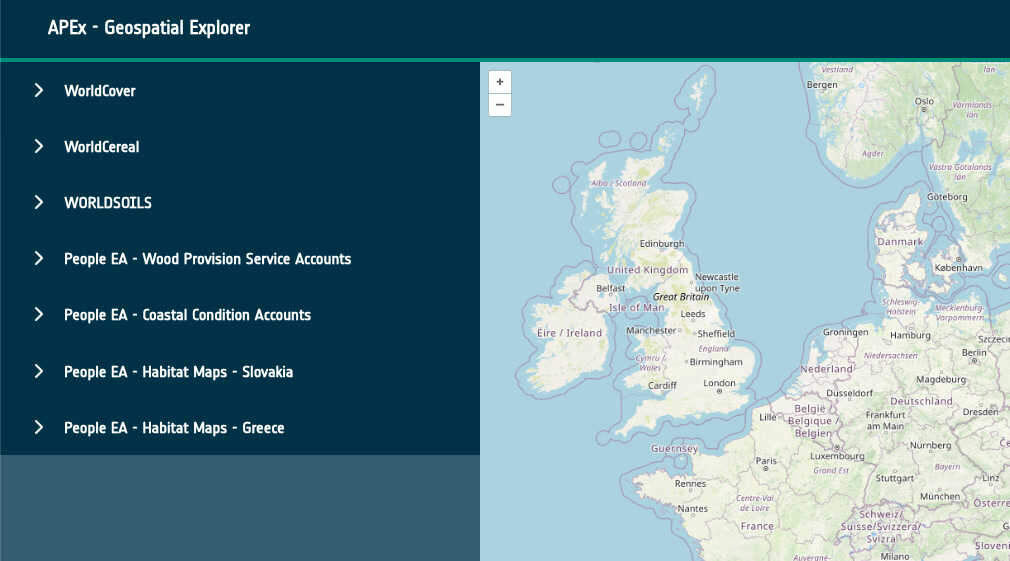
Clicking on a specific layer group expands the layers within that group and displays a brief description of what that layer comprises.

Expanded layer groups

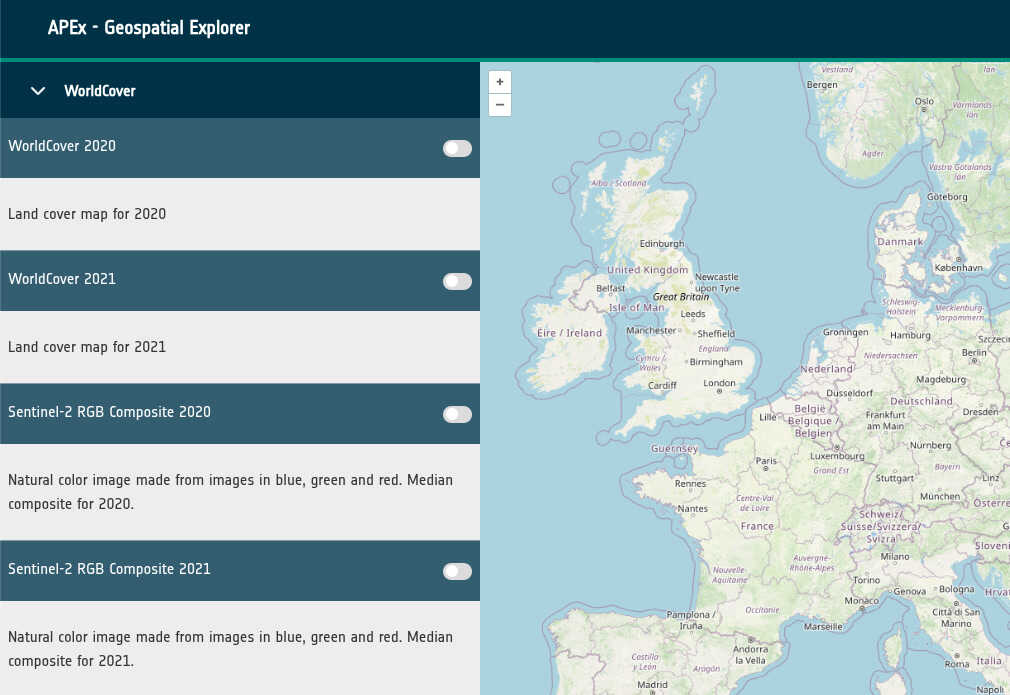
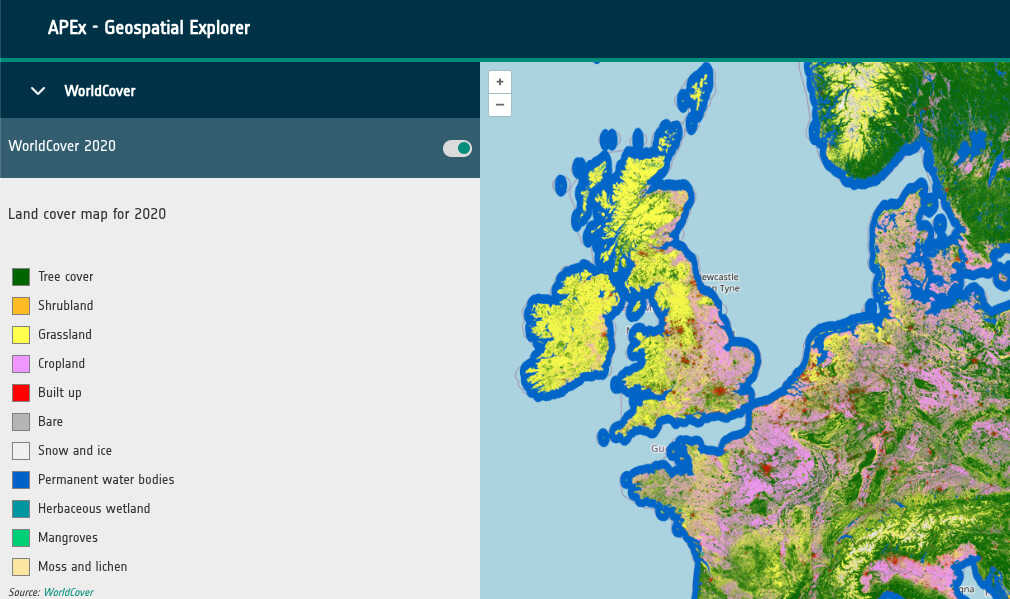
To add the data on to the map, use the toggle button. Once a layer is toggled on the layer panel will expand to show you more information about the layer - for example, a legend to help you interpret the map. If it has been configured you may also see an attribution link, which may link you out to a project page or metadata record about the layer. The example below has been linked to the World Cover website.

Layer displayed with legend and attribution statement

In some cases, according to how the explorer has been configured switching one layer on may switch others off. These mutually exclusive groups are often set up when it only makes sense to show one layer at a time, because viewing one layer would completely obscure another layer in the group.

Layer opacity

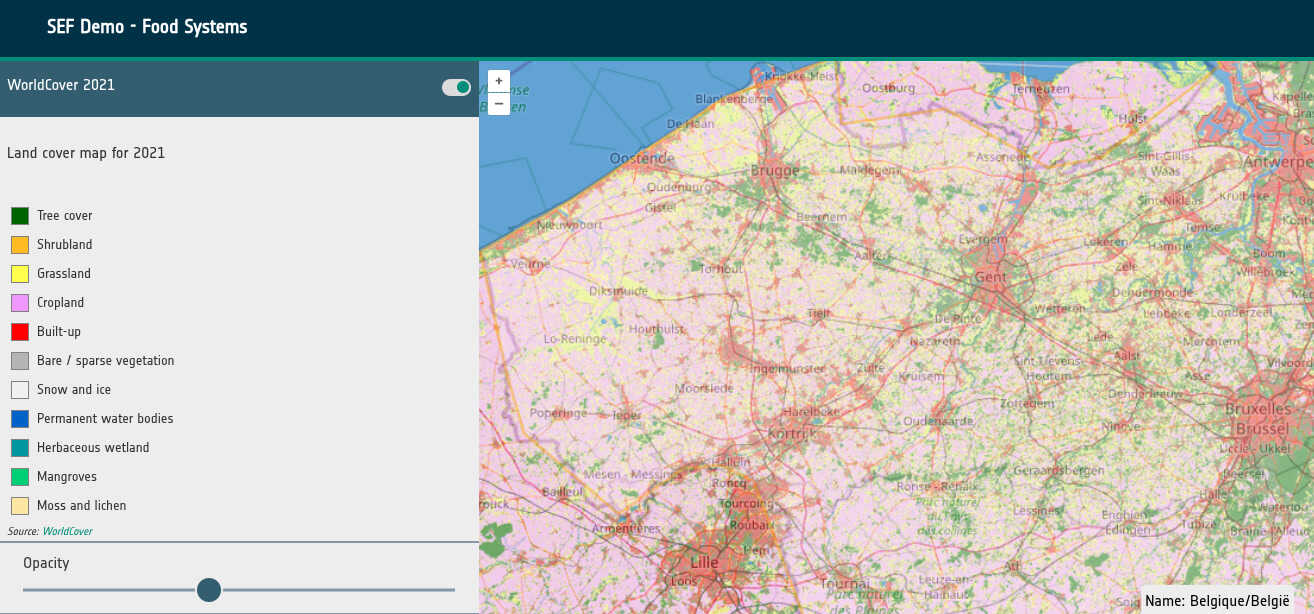
In some circumstances a layer may have been configured to include an opacity control. This gives you a slider that allows you to change the level of opacity to make the layer partially transparent, allowing you to view other map layers (such as background mapping) beneath the layer.
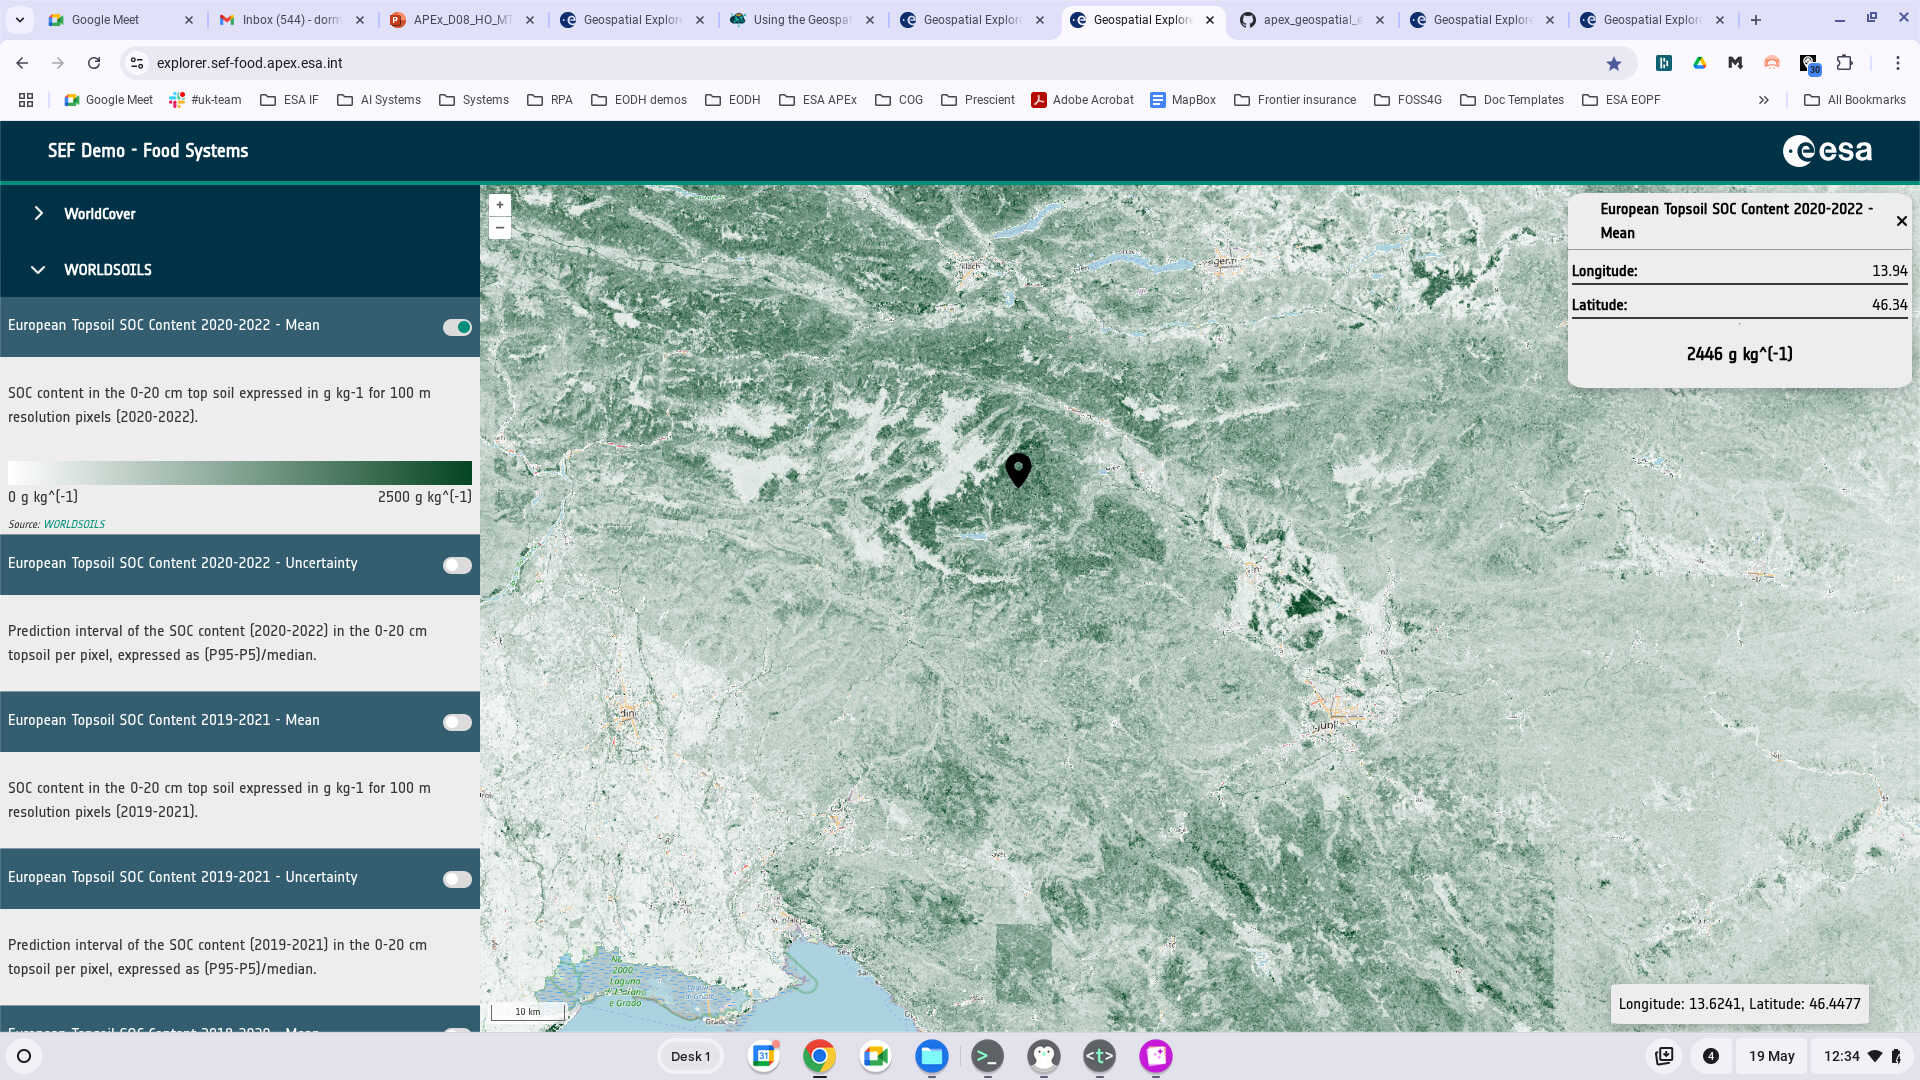
Opacity slider

Layer “info” box

For some layers (such as the European Top Soil Layers in the SEF Food Demo) clicking on the map drops a marker and displays an “info” box of the latitude, longitude and data value at the marker location, allowing you to display the precise value of the data at that point.
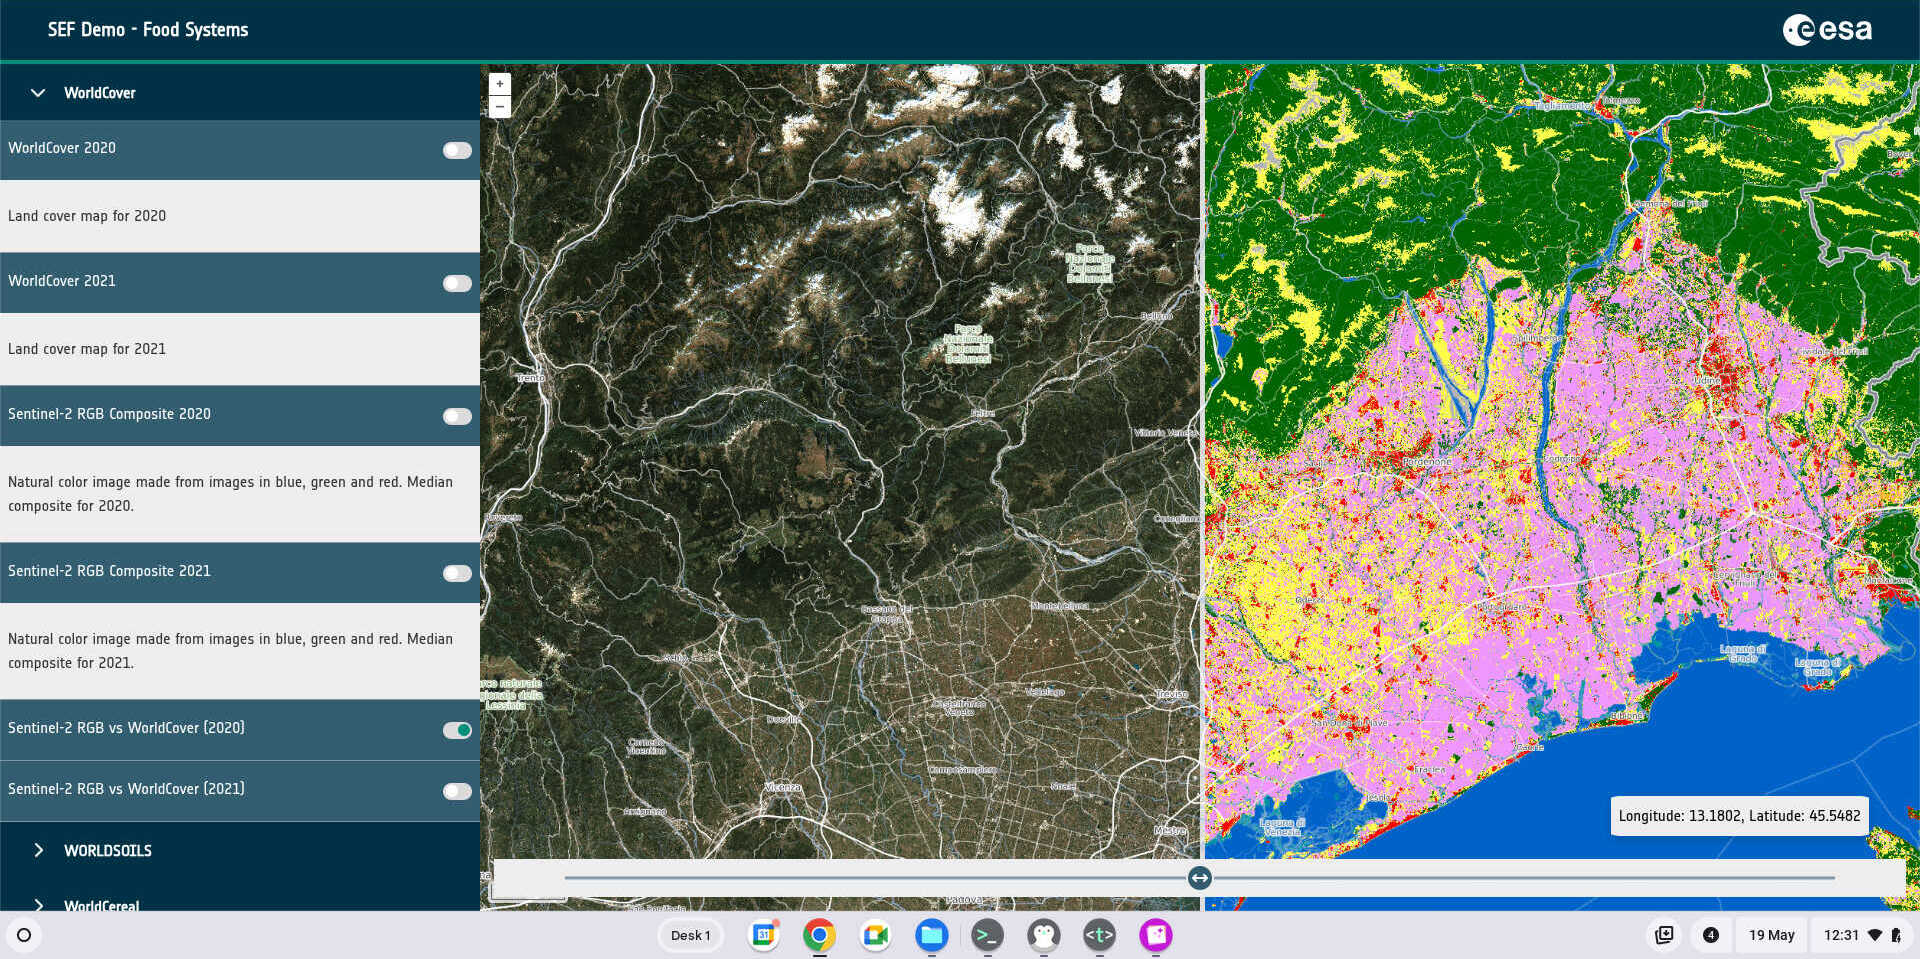
Layer info box

Split screen view

The Geospatial Explorer also allows different layers to be compared in a split screen view. In the current release of the explorer, these comparison layers are defined in the configuration for a given explorer, but in a future release it will be possible for you to choose your own pair of layers to view in a split screen mode. When you are in a split screen mode, the slider at the bottom of the map allows you to “swipe” from left to right to compare the two layers with one another.

Split screen view

Statistics

Statistical data can also be displayed in the Geospatial Explorer as tables, charts and graphs. These statistics are pre-computed for performance reasons, to specific boundary areas. These could be administrative (e.g. national, regional or local boundaries) or natural (e.g. river basins). The statistics that are available will depend on what the administrator of the Geospatial Explorer has defined for you.

Statistics

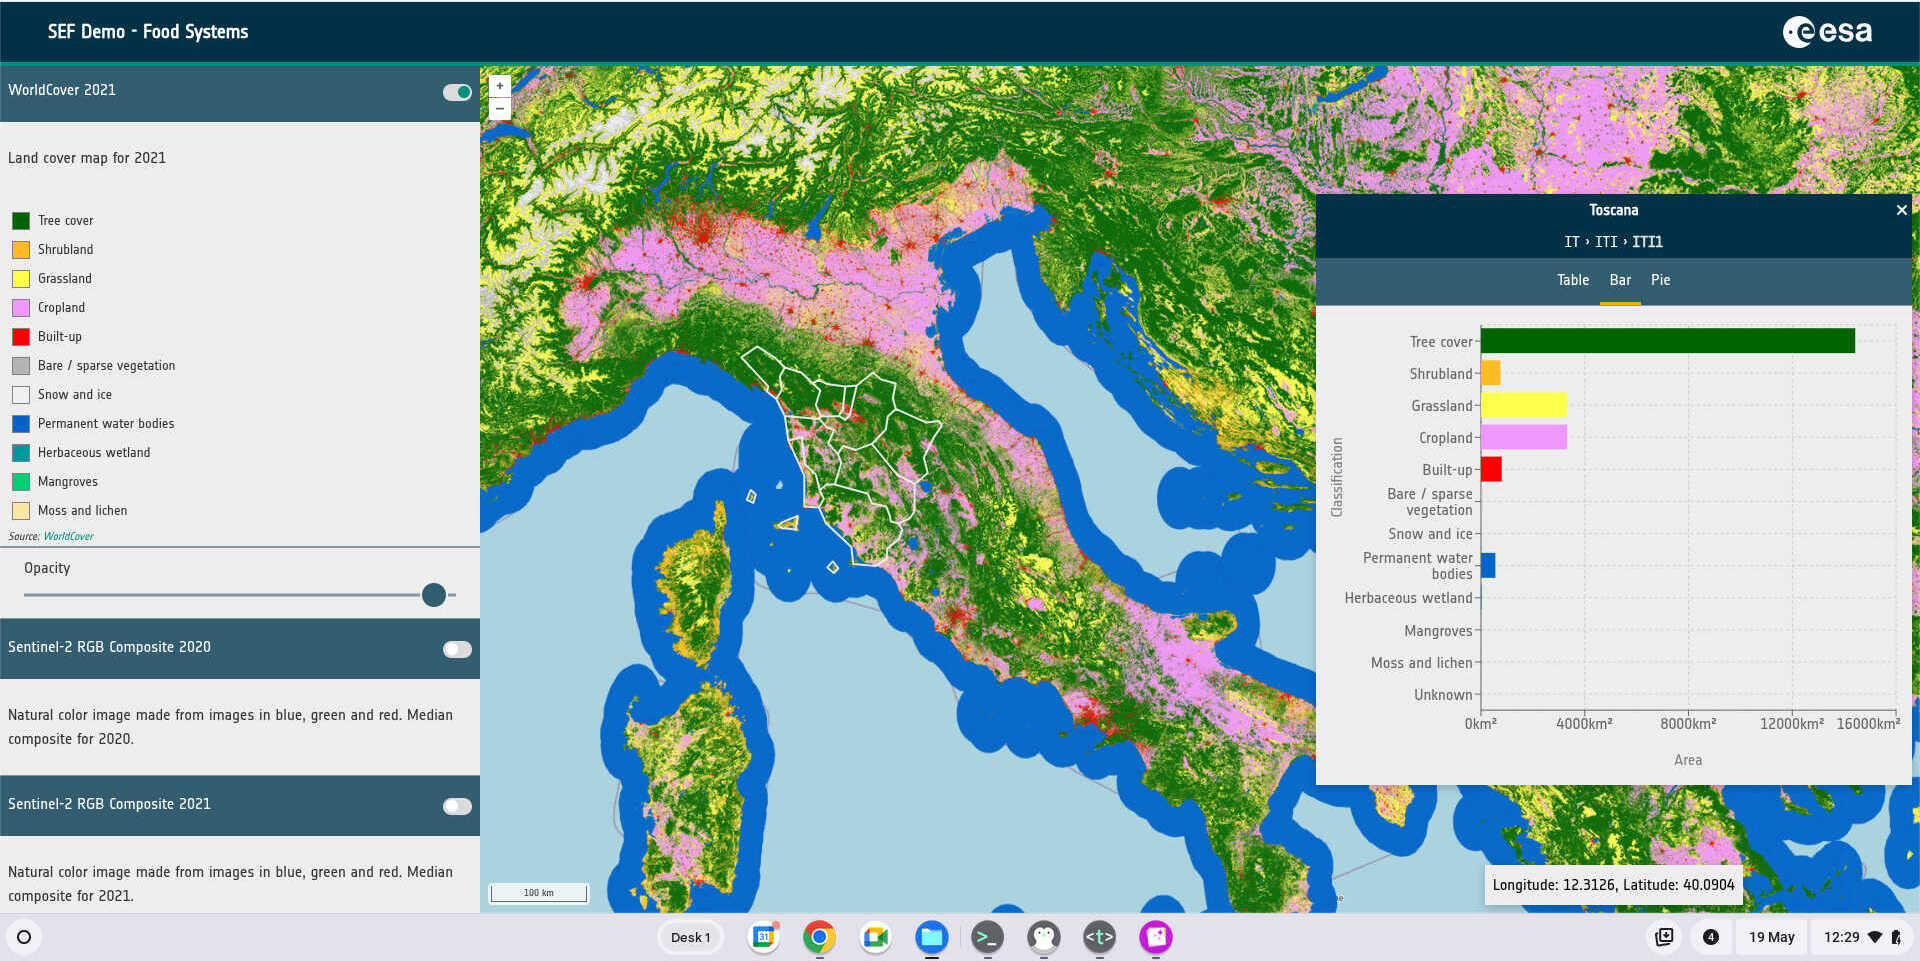
To access these, simply click on a polygon to display the statistics panel and then select from the table, bar or pie chart options.

In some cases, there may be a hierarchy of boundaries available, allowing users to “drill down” from national to regional to local levels. Each time a boundary is selected, the set of available boundaries at the next tier down are displayed.

You will also notice that the statistics panel then contains a “breadcrumb” view of the boundaries. You can navigate back up through your hierarchy by clicking on elements within the breadcrumb view.

Configuring the APEx Geospatial Explorer
Project Portal